Paris climate targets, EU climate targets, German climate targets – what were the differences again?
In December 2015, the Paris Climate Agreement[2] was adopted at the international climate conference, marking a groundbreaking measure to combat climate change. While the agreement provides an international framework for climate protection, both the European Union[3] and Germany[4] have adopted dedicated laws and initiatives to achieve their own climate targets.
Although all initiatives pursue the same overarching goal – to achieve net zero – they differ in their (interim) targets and planned measures for GHG[5] reduction. Financial institutions need to discuss which specific ambitions they should pursue and what laws and regulations they need to comply with.
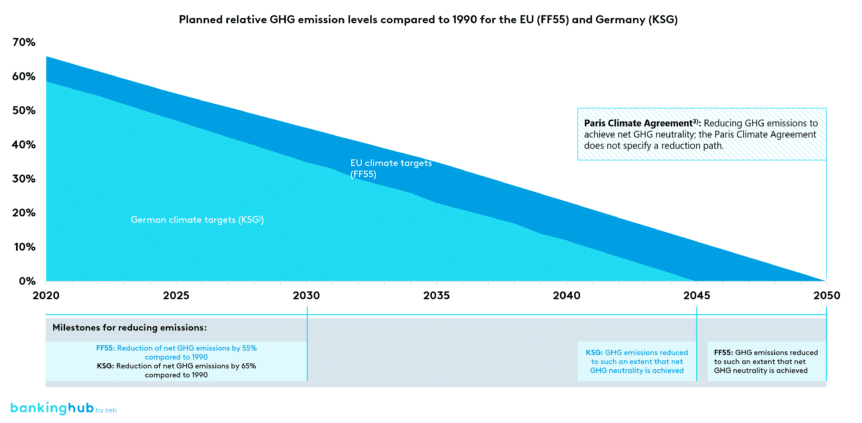
A look at the Paris, EU and German GHG trajectories according to the different ambitions illustrates these differences (Figure 1).
Overview of decarbonization scenarios as a basis for deriving a target trajectory
Science-based scenario data can model target trajectories for a bank’s credit portfolio, whether for the entire portfolio or specific sectors. Some providers offer retrievable data on decarbonization scenarios, which can be integrated into banks’ carbon accounting models.[6]
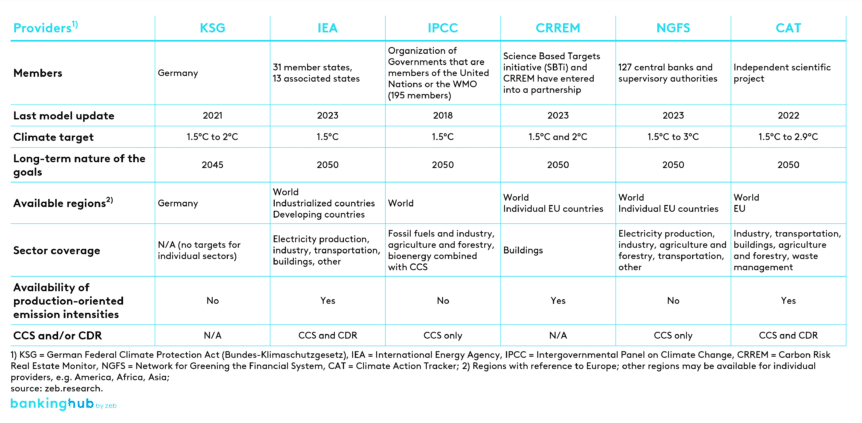
When selecting a provider for target trajectory modeling and application to one’s own portfolio, it is necessary to consider various factors, including geographical and sectoral coverage, the time horizon of the targets, the availability of production-oriented emission intensities (e.g. CO2e/m2 for the real estate sector) and coverage of negative emissions like Carbon Capture and Storage (CCS) or Carbon Dioxide Removal (CDR). The following figure provides an overview of the aforementioned providers and the availability of relevant information.
The IEA (International Energy Agency) is one of the providers of decarbonization scenarios used as references for target emissions and emission intensities, particularly in the context of Pillar III disclosure. This agency offers a data explorer to determine target trajectories for specific regions and sectors.
At sector level, the IEA distinguishes between electricity, industry, transportation, buildings and others. By mapping these sectors to PCAF asset classes and NACE codes, target trajectories can be easily assigned to different loan portfolios and customer groups.
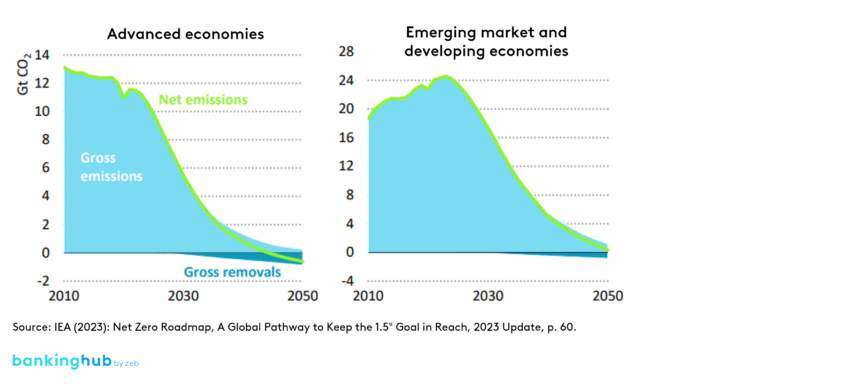
The IEA data also allows for the derivation of economic and production-oriented emission intensities, which are useful for Pillar III reporting. The following graphic illustrates an example of the global IEA target trajectory (Figure 3).
Key challenges in deriving target trajectories
In practice, financial institutions encounter a number of stumbling blocks on their way to defining climate target trajectories for their own loan portfolio. Selected key challenges are explained below.
Procuring and preparing suitable target trajectory scenario data
While some providers make their data available for free, others require users to procure a license. In addition, the data is not always available in structured form, but must be extracted from publications, for example. To meet the Pillar III reporting requirements, this data needs to be enriched with additional information, for example by mapping it to PCAF asset classes.
It is crucial for banks to map the correct information in the appropriate format to their credit portfolio. Consequently, data collection becomes a major undertaking.
Deriving production-oriented emission intensities
According to the requirements of the EBA-ITS for the disclosure of ESG risks (Pillar III) or the CSRD, production-oriented emission intensities, which relate GHG emissions to physical production quantities such as megawatt hours in the energy sector or square meters in the real estate sector, must be disclosed and target trajectories defined on this basis. Since physical production figures are not typically part of the data recorded for financing, banks are faced with the challenge of establishing new databases or proxy logic to meet disclosure obligations.
Numerous commercial data providers make available industry averages and, in some cases, customer-specific production figures. However, depending on their business model, regional banks in particular often have access to individual data only for a fraction of their customers, and the smaller the customers, the more difficult it is to obtain this data. Industry averages must serve as a temporary solution and gradually be replaced by customer-specific data.
Defining suitable metrics and target trajectories for internal management
Beyond regulatory ESG reporting obligations, financial institutions need to integrate decarbonization targets into their internal risk management as well as their strategic planning and management. Production-oriented emission intensities are often impractical for these purposes, as institutions typically base multi-year plans on metrics like exposure, risk weightings, and margins, rather than including financed areas or energy production data. Absolute emission values or financial or economic emission intensities are therefore more appropriate for the internal management of a financial institution’s portfolio – financial emission intensities relate GHG emissions to the balance/exposure, the derivation of which requires additional calculation logic.
How much do European banks need to do in terms of ESG? Download our ESG Implementation Study!

ESG Implementation Study 2024
Europe’s banks under the microscope: between ecological ambition and economic realityExample of a solution approach based on the IEA scenario
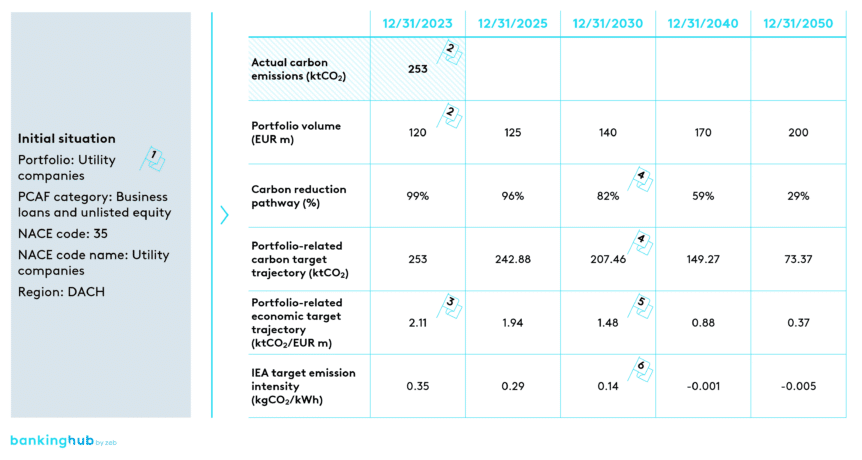
Given the challenges in determining suitable target trajectories, financial institutions must explore available solutions to address these operational questions. The following example illustrates the calculation logic for suitable target trajectories using a portfolio for energy supply (Figure 4).
BankEnergie follows these steps to establish the GHG target and target emission intensity for 2030:
- BankEnergie finances various energy suppliers in its region. Loans to energy suppliers are allocated to NACE code 35 (energy supply).
- As of December 31, 2023, BankEnergie reported actual carbon emissions of 253 kt for its energy portfolio, which has a volume of EUR 120 million.
- This equates to 2.11 ktCO2/EUR m of financed carbon emissions.
- BankEnergie uses IEA data to calculate its target trajectory. The IEA’s carbon target in the energy sector for 2030 is 82%, based on 2022 levels. Consequently, the portfolio-related carbon target trajectory is 207.46 ktCO2 (= 82 % * 253 ktCO2 = 207,46 ktCO2).
- The portfolio-related economic target trajectory for 2030 is 1.48 ktCO2/EUR m (= 82 % * 253 ktCO2 / 140 m€ = 1,48 ktCO2 / m€).
- In addition to the financed emissions, BankEnergie must also report a production-based target emissions intensity for its portfolio for Pillar III reporting. For this purpose, the institution uses the metric provided by the IEA (kgCO2/kWh). The target emission intensity for 2030 is 0.14 kgCO2/kWh.
BankingHub-Newsletter
Analyses, articles and interviews about trends & innovation in banking delivered right to your inbox every 2-3 weeks
"(Required)" indicates required fields
Conclusion and outlook
In view of the regulatory requirements and their own strategic ambitions, financial institutions are faced with the task of developing suitable target trajectories as part of their transition plan to both optimize their environmental footprint and reduce transitory risks.
Science-based scenarios and providers like the IEA provide a basis for modeling target trajectories with their data and projections. When implementing target trajectories in one’s own credit portfolio, various factors must be taken into account, such as the selection of a suitable provider and data sets that cover the portfolio’s geographical and sectoral specifics.
Depending on requirements and information needs, target trajectories must also be provided in different metrics, e.g. absolute emissions, production-based or economic GHG intensities, which presents additional challenges for banks. For the practical implementation of target trajectories in the credit portfolio, a smart logic is therefore recommended that selects the target trajectory data according to sectoral and geographical portfolio specifics and the PCAF asset class and derives it in a suitable metric for the required target year.
Carbon accounting and decarbonization: More topics
To operationalize target trajectory calculations and effectively measure target/actual progress, the following additional topics must be methodically discussed and technically implemented:
- Consideration of customer-specific emission intensities when determining the portfolio target trajectory
- Defining sector and portfolio-specific measures and scenario-based simulation of their impact on emissions reduction
- Establishment of a carbon level to differentiate effects that have led to a delta in emissions between two reporting dates, particularly separating real transformation from changes in data quality
- Approaches for re-baselining if the scenario or base data changes significantly
The subsequent BankingHub articles will explore these and other topics related to carbon accounting and decarbonization in financial institutions.


